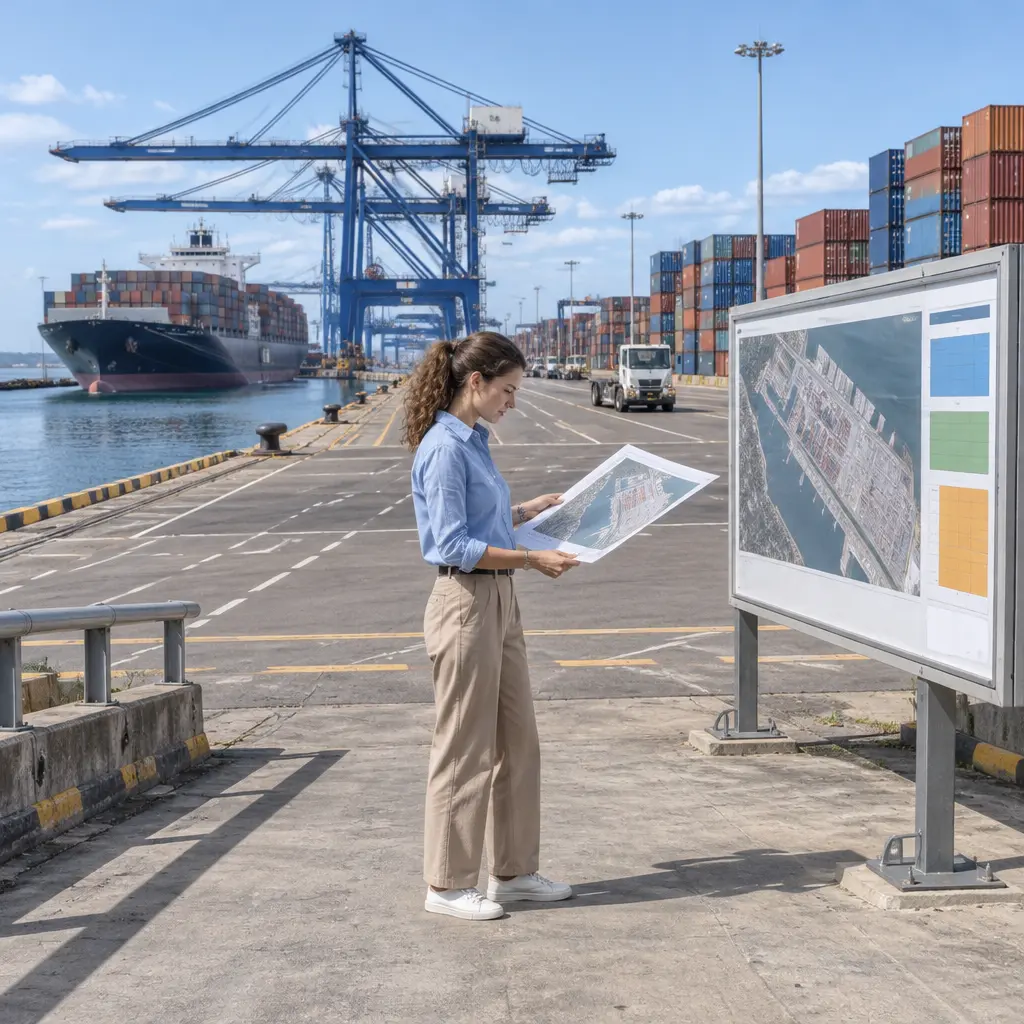
Port capacity planning is the process of matching a port’s infrastructure, equipment, labor, and operating rules to expected cargo and vessel demand. Advanced port capacity planning combines demand forecasting, terminal simulation, berth and yard optimization, investment appraisal, and operational data to identify bottlenecks before they constrain trade. The need is substantial: UN Trade and Development (UNCTAD) reports that around 80% of the volume of international trade in goods is carried by sea. Effective planning therefore matters not only to port operators, but also to shipping lines, cargo owners, governments, and communities affected by congestion and expansion.
Port capacity planning defines usable throughput, not just maximum capacity
Capacity is not a single number. In port planning, it is the amount of cargo or vessel traffic a port can handle over a specified period while meeting defined service, safety, cost, and environmental conditions. The World Bank’s Port Reform Toolkit treats port performance as a combination of operational, financial, and service measures; this framing helps distinguish installed capacity from capacity that can reliably be delivered.
A terminal may advertise annual design capacity, but actual throughput depends on how the entire port system performs: the channel and berth, cranes, yard, gates, rail and road links, labor availability, and vessel schedules. A high-performing berth cannot compensate for a yard that has no room for incoming containers. Planning should therefore evaluate capacity at the system level and identify the constraint that limits end-to-end flow.
Common capacity measures include annual throughput in tonnes or twenty-foot equivalent units (TEU), berth occupancy, crane productivity, vessel waiting time, yard utilization, truck turn time, and rail dwell time. Their meaning depends on the period and operating assumptions. For example, annual throughput describes volume, while berth occupancy indicates how heavily berth time is used; neither alone proves that a port can handle peak-season demand without delay.
Design capacity and effective capacity
Design capacity is the theoretical or engineered limit under specified assumptions. Effective capacity is the output achievable in normal operations after accounting for maintenance, weather, shift patterns, equipment reliability, labor rules, and service targets. The distinction is essential: using a design figure as a forecast of dependable throughput can understate the need for buffers and contingency plans.
Planners should document each assumption behind a capacity estimate, including vessel mix, cargo handling rates, operating hours, and acceptable queueing or delay. Comparing design and observed performance also helps reveal whether a shortfall calls for new infrastructure, better operating practices, or both.
Nominal capacity, practical capacity, and resilience
Nominal capacity represents a stated maximum; practical capacity reflects achievable output under expected conditions; resilient capacity is the level that can be maintained through disruptions or demand surges. These categories prevent a common planning error: treating every available berth-hour, crane-hour, or yard slot as continuously productive.
Resilience requires headroom for equipment failures, severe weather, channel restrictions, labor disruption, and vessel bunching. UNCTAD’s Review of Maritime Transport has documented how disruptions in shipping networks can sharply alter schedules and port calls. A capacity plan should therefore test not only average demand but also clustered arrivals and recovery after interruptions.
Demand forecasting links port capacity to trade and vessel patterns
Demand forecasting estimates future cargo volumes, vessel calls, and associated landside movements over a planning horizon. The American Association of Port Authorities’ port-planning guidance emphasizes that forecasts should connect market conditions and cargo forecasts to infrastructure needs, rather than extrapolating a single historical growth rate.
Forecasts are uncertain because trade depends on economic growth, commodity markets, supply-chain choices, shipping networks, regulations, and competing ports. The practical response is to use multiple scenarios and update them as evidence changes. Forecasts should also distinguish total annual volume from peak-week or peak-day demand, since peaks often determine the service level and infrastructure required.
Scenario-based cargo forecasting
Scenario-based forecasting compares plausible futures, such as a baseline, high-growth, and low-growth case. A port might also test specific events: a new shipping service, a major industrial project, a change in trade policy, or the diversion of cargo from another gateway. Each scenario should specify its assumptions and translate cargo forecasts into vessel sizes, call frequency, handling requirements, and landside flows.
This approach is more useful than presenting one precise-looking number without a confidence range. Decision-makers can identify investments that perform acceptably across scenarios and defer investments whose benefits depend on uncertain growth.
Peak demand and vessel bunching
Peak demand describes the short periods when cargo or vessel arrivals exceed average levels. Vessel bunching occurs when ships scheduled at different times arrive close together, often following delays elsewhere in a route. Both can create queues even where annual throughput remains below a terminal’s nominal capacity.
Planners should analyze arrival distributions and seasonal profiles, not just yearly totals. Queueing models and historical call records can estimate the effect of arrival variability on waiting time and berth utilization. This helps determine whether the solution is more berth capacity, schedule coordination, extra shifts, temporary storage, or improved landside appointments.
Bottleneck analysis identifies the constraint on port throughput
Bottleneck analysis finds the process or asset that limits the throughput of the wider port system. A bottleneck can move as operations change: adding quay cranes may shift the constraint to yard space, gate processing, rail capacity, or channel access. The concept follows the general operations principle that system output is constrained by its least capable or most heavily loaded stage.
A useful analysis maps cargo flow from vessel arrival through berth, transfer, storage, and onward transport. It compares demand with capacity at each stage, then checks whether the apparent constraint is persistent or specific to particular cargoes, shifts, or seasons.
Berth and channel capacity
Berth capacity depends on the number and length of berths, vessel size, handling rates, setup time, maintenance windows, and the pattern of arrivals. Channel capacity adds constraints such as draft, tidal windows, navigation rules, and the safe spacing of vessel movements. A port with adequate quay length may still face limited access if ships cannot enter or depart freely.
Berth occupancy is a key diagnostic, but it should not be treated as a universal pass-or-fail threshold. As occupancy rises, vessels have fewer opportunities to berth promptly when arrivals vary. Planners should assess occupancy alongside waiting time, schedule reliability, vessel mix, and the port’s service objectives.
Crane, yard, and gate constraints
Quay cranes determine how quickly cargo can be transferred between ship and shore, while yard systems determine how efficiently cargo is stored, retrieved, and staged. Gate and rail capacity govern how quickly cargo can leave or enter the terminal. The effective chain depends on synchronization: increasing crane productivity without improving yard evacuation can intensify congestion rather than increase end-to-end throughput.
For container terminals, yard utilization and dwell time are especially important. Longer cargo dwell occupies storage positions for more days and reduces the terminal’s ability to absorb new arrivals. Monitoring dwell by cargo type, customer, and transport mode can reveal targeted actions such as appointment systems, extended gate hours, or improved rail coordination.
Labor, equipment reliability, and operating windows
Labor availability, shift design, skills, and work rules affect the hours and productivity a terminal can sustain. Equipment reliability affects the share of scheduled time that cranes, yard machines, and support systems are available for work. Weather, tides, visibility, and environmental restrictions can further reduce operating windows.
Capacity studies should use actual operating records where possible, including downtime causes and maintenance histories. This separates a structural shortage from avoidable losses caused by poor maintenance planning, inadequate staffing, or inefficient shift handovers.
Simulation and optimization test capacity decisions before investment
Simulation represents port operations over time so planners can test how vessels, equipment, labor, and cargo interact under different conditions. Optimization methods then search for better schedules, resource allocations, or investment combinations. Together, these tools can compare alternatives that are difficult to assess through annual averages alone.
The United Nations Conference on Trade and Development (UNCTAD) has promoted port performance measurement as a basis for evidence-led management. Simulation extends that evidence by testing proposed changes against operational variability, including arrival patterns, service times, and disruptions. Models should be validated against observed data and their assumptions disclosed so decision-makers understand what the results can and cannot establish.
Discrete-event simulation
Discrete-event simulation models operations as a sequence of events, such as a ship arriving, a berth becoming available, a crane failing, or a truck entering a gate. It can estimate queues, resource utilization, throughput, and delay while accounting for variability. This makes it suitable for testing berth allocation, equipment levels, operating hours, and peak-period scenarios.
A credible model needs representative input data and calibration. Analysts should compare simulated results with historical performance, test sensitivity to uncertain inputs, and explain whether the model represents a typical week, a peak period, or a disruption scenario.
Digital twins and real-time operational data
A port digital twin is a digital representation of physical assets and operations that can be updated with operational data. It may combine vessel tracking, terminal operating systems, equipment telemetry, weather, and landside information to monitor conditions and explore possible actions.
A digital twin is not automatically a forecast or an optimization tool: its value depends on data quality, integration, governance, and the decision process it supports. Ports should define practical uses—such as identifying emerging congestion or comparing berth plans—and establish safeguards for cybersecurity, data access, and model validation.
Optimization of berth, equipment, and appointments
Optimization applies mathematical methods to select a preferred plan under stated objectives and constraints. Examples include assigning vessels to berths, allocating cranes, scheduling labor, sequencing yard moves, and managing truck appointments. Objectives may include reducing waiting time, increasing throughput, lowering cost, or limiting emissions.
Because objectives can conflict, planners should test trade-offs rather than pursue a single metric. A plan that maximizes berth utilization may leave little recovery capacity; one that minimizes truck queues may shift delays to rail or storage. Scenario testing helps reveal these effects before operational rules are changed.
Investment appraisal connects capacity plans to cost and public value
Investment appraisal compares the costs, benefits, risks, and timing of alternative capacity measures. Options range from maintenance and process improvements to digital systems, equipment upgrades, berth extensions, dredging, and new terminals. A sound plan compares capital projects with operational measures instead of assuming that construction is the only route to more capacity.
The World Bank’s port-sector guidance stresses the importance of assessing institutional, financial, and operational conditions alongside infrastructure. Appraisal should account for the port’s financial position, user costs, public impacts, environmental requirements, and the risk that forecast demand does not materialize.
Staged investment and real options
Staged investment breaks a large capacity program into decisions that can be revisited as demand and performance become clearer. A port might first improve equipment reliability and gate operations, then add handling equipment, and reserve major construction for a later trigger. This preserves flexibility and reduces the chance of building capacity too early.
Real-options thinking values the ability to delay, expand, or adapt an investment in response to new information. It is especially relevant when projects are costly, long-lived, and exposed to uncertainty in trade, technology, climate, or regulation.
Cost-benefit analysis and external impacts
Cost-benefit analysis compares project costs with expected benefits over time, using consistent assumptions about demand, operating costs, delay reduction, and asset life. A comprehensive assessment also considers impacts beyond the port boundary, including road congestion, emissions, noise, habitat, public safety, and community access.
The International Maritime Organization’s greenhouse-gas strategy sets a direction for reducing emissions from international shipping, while port investments can influence vessel turnaround, truck activity, and energy use. Capacity options should therefore be assessed for both throughput and environmental performance, including opportunities for shore power, electrified equipment, and efficient modal connections where suitable.
Risk-adjusted appraisal and funding
Risk-adjusted appraisal tests how project value changes under uncertainty in construction cost, demand, financing, operating performance, and policy. Sensitivity analysis and scenario analysis can show which assumptions drive the result and where contingency plans are needed.
Funding structures also affect project choices. Public authorities, port authorities, terminal operators, and private investors may have different incentives and risk tolerances. Transparent allocation of responsibilities and risks helps ensure that the selected capacity solution is financially viable and aligned with the public interest.
Port resilience planning protects capacity during disruption
Resilience planning assesses whether a port can prepare for, withstand, respond to, and recover from disruptions while maintaining essential service. Relevant hazards include storms, flooding, heat, sea-level rise, cyber incidents, equipment failures, labor interruptions, and interruptions to road, rail, or energy supply.
UNCTAD’s analysis of maritime transport disruptions demonstrates that shocks can propagate through interconnected shipping and logistics networks. Capacity planning should therefore include continuity and recovery requirements, not merely the ability to process normal demand.
Climate and natural-hazard scenarios
Climate-risk assessment evaluates how changing hazards may affect port assets, access routes, operating days, and service reliability over an asset’s lifetime. The Intergovernmental Panel on Climate Change (IPCC) reports that climate-related risks to infrastructure and coastal systems increase with warming, although local exposure and impacts vary.
Ports can incorporate local flood, storm-surge, heat, and sea-level scenarios into asset design and maintenance plans. The analysis should consider interdependencies: a terminal may remain intact but lose service if power, a bridge, a rail corridor, or a channel becomes unavailable.
Cybersecurity and operational continuity
Cybersecurity is a capacity issue because terminal operating systems, port community systems, vessel traffic services, and connected equipment support daily operations. A cyber incident can reduce throughput even when physical infrastructure remains undamaged.
The International Maritime Organization’s maritime cyber-risk guidance recommends integrating cyber risk into existing safety and security management. Capacity plans should include incident response, backup procedures, recovery priorities, staff training, and coordination among port authorities, operators, shipping lines, and service providers.
Contingency capacity and recovery targets
Contingency capacity is the reserve in facilities, labor, time, or operating flexibility available to absorb unexpected demand or disruption. It can include alternative berths, spare equipment, emergency access arrangements, flexible shifts, and agreements with nearby ports or inland terminals.
Planners should define measurable recovery objectives, such as the time to restore a critical service or clear a disruption-related backlog. Exercises and after-action reviews can test whether plans are realistic and update capacity assumptions based on lessons learned.
Port performance metrics turn plans into operational decisions
Performance metrics connect strategic plans to day-to-day management. The World Bank and International Association of Ports and Harbors’ port performance work emphasizes indicators that allow ports to assess service, operational efficiency, and sustainability. Metrics are most useful when definitions are consistent and results are interpreted in context.
A balanced scorecard can combine throughput and productivity with service reliability, safety, asset condition, emissions, and landside performance. No single indicator captures capacity: a port can increase annual volume while experiencing worsening delays, or improve berth productivity while shifting congestion to roads and storage areas.
Core operational indicators
Useful indicators include vessel waiting time, time at berth, berth occupancy, crane moves per hour, equipment availability, container dwell time, truck turn time, rail dwell time, and schedule reliability. Each metric should specify its unit, data source, population, and reporting period so comparisons are meaningful.
For example, vessel waiting time should distinguish time caused by berth unavailability from delays caused by weather, navigation restrictions, or late arrival. This attribution helps managers select an intervention that addresses the actual cause.
Service, safety, and sustainability measures
Service measures can include the share of vessels served within an agreed time window and the reliability of cargo connections. Safety measures may track incidents, near misses, and equipment-related events. Sustainability indicators can include energy consumption, greenhouse-gas emissions, local air pollutants, and the proportion of cargo moved by rail or other lower-impact modes where available.
These measures prevent capacity decisions from optimizing volume at the expense of safety, service quality, or environmental obligations. They also make trade-offs visible to port users and the public.
A practical measurement and review cycle
A practical review cycle begins by defining objectives and metric definitions, establishing a baseline, collecting reliable data, diagnosing constraints, implementing interventions, and measuring results. Forecasts and plans should then be updated as demand, operations, and risks change.
Where appropriate, ports can publish a concise performance dashboard and explain major changes. Transparent reporting strengthens accountability and helps stakeholders distinguish between a temporary disruption and a structural capacity problem.
Conclusion: advanced port capacity planning aligns growth with reliable service
Advanced port capacity planning treats capacity as a system-wide, evidence-based measure rather than a single design number. Demand scenarios anticipate changes in cargo and vessel patterns; bottleneck analysis locates constraints; simulation and optimization test operational choices; investment appraisal compares projects with lower-cost alternatives; resilience planning prepares for disruption; and performance metrics show whether interventions work.
Because maritime transport carries a large share of global goods trade, port congestion and investment decisions have consequences well beyond the quay. Port authorities and operators should maintain current, validated data; test multiple demand and disruption scenarios; coordinate with shipping and inland-transport partners; and review plans regularly. For further work, consult UNCTAD’s maritime transport reviews, the World Bank’s port-sector guidance, and the IPCC’s climate-risk assessments when developing local, evidence-based capacity plans.
Sources: United Nations Conference on Trade and Development, Review of Maritime Transport 2024, https://unctad.org/publication/review-maritime-transport-2024; World Bank, Port Reform Toolkit, https://ppiaf.org/documents/3553/download; American Association of Port Authorities, Port Planning and Investment Resources, https://www.aapa-ports.org/; United Nations Conference on Trade and Development, Port Performance Scorecard, https://unctad.org/topic/transport-and-trade-logistics/port-performance; International Maritime Organization, 2023 IMO Strategy on Reduction of GHG Emissions from Ships, https://www.imo.org/en/OurWork/Environment/Pages/2023-IMO-Strategy-on-Reduction-of-GHG-Emissions-from-Ships.aspx; Intergovernmental Panel on Climate Change, Climate Change 2022: Impacts, Adaptation and Vulnerability, https://www.ipcc.ch/report/ar6/wg2/; International Maritime Organization, Maritime Cyber Risk, https://www.imo.org/en/OurWork/Security/Pages/Cyber-security.aspx